
Financial markets are inherently volatile, and investors must continuously balance assessments of upside return potential with downside risk. One of the most critical challenges investors face is drawdown – a temporary decline in portfolio value from its peak. While short-term market fluctuations are common, significant drawdowns can disrupt long-term financial plans, trigger emotional decision-making, and delay wealth accumulation due to the compounding effect of losses. Understanding the causes, impact and management of drawdowns is essential for an investor seeking to minimize risk and maximize long-term returns.
This paper explores the historical context of major market drawdowns, their psychological and financial consequences and practical strategies investors can use to mitigate their effects. By recognizing the patterns and risks associated with drawdowns, investors can develop a more disciplined and resilient approach to investing.
What is drawdown and how is it measured
A drawdown refers to the decline in the value of an investment portfolio from its peak value to its lowest value before a new high is reached. Using historical data, it is typically measured as a percentage change from the trough relative to the previous peak. While it is an important metric for assessing the risk of a strategy, it is often overlooked, possibly because it requires more effort to compute than standard risk measures such as return volatility.
To illustrate, we compute drawdown for the S&P 500 Index using almost a century of annual total return data from 1928-2024.[1]
Exhibit 1: S&P 500 Index’s total returns and drawdowns (1928-2024)
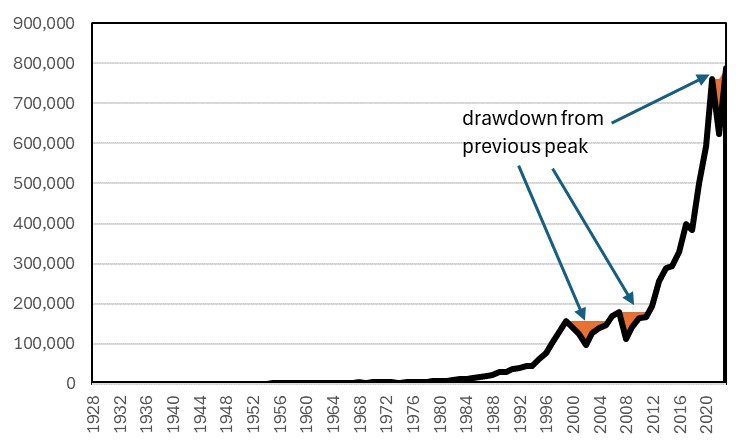
Source: Damodaran dataset, Bank of Singapore.
Exhibit 1 shows the nominal value of USD100 invested in the S&P from 1928 (black line) and the drawdown periods (shaded in orange) over the entire time frame (1928-2024). Earlier drawdowns in the sample are not fully visible in this chart, because of compounding which results in exponentially higher valuations through time that dwarf the magnitude of earlier levels.
Exhibit 2 shows the conventional approach of illustrating drawdowns, with all drawdowns visible: the amplitude (measured along the vertical axis) shows the extent of the drawdown relative to the previous highest level at that point in time, while the span of the shaded area (along the horizontal axis) shows the duration of the full drawdown period (including recovery).
Exhibit 2: S&P 500 Index’s drawdowns (1928-2024, annotated for ease of exposition)
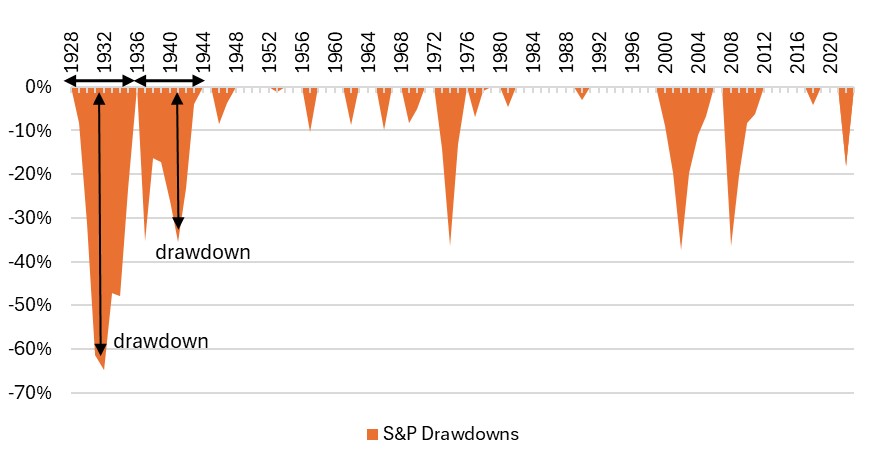
Source: Damodaran dataset, Bank of Singapore.
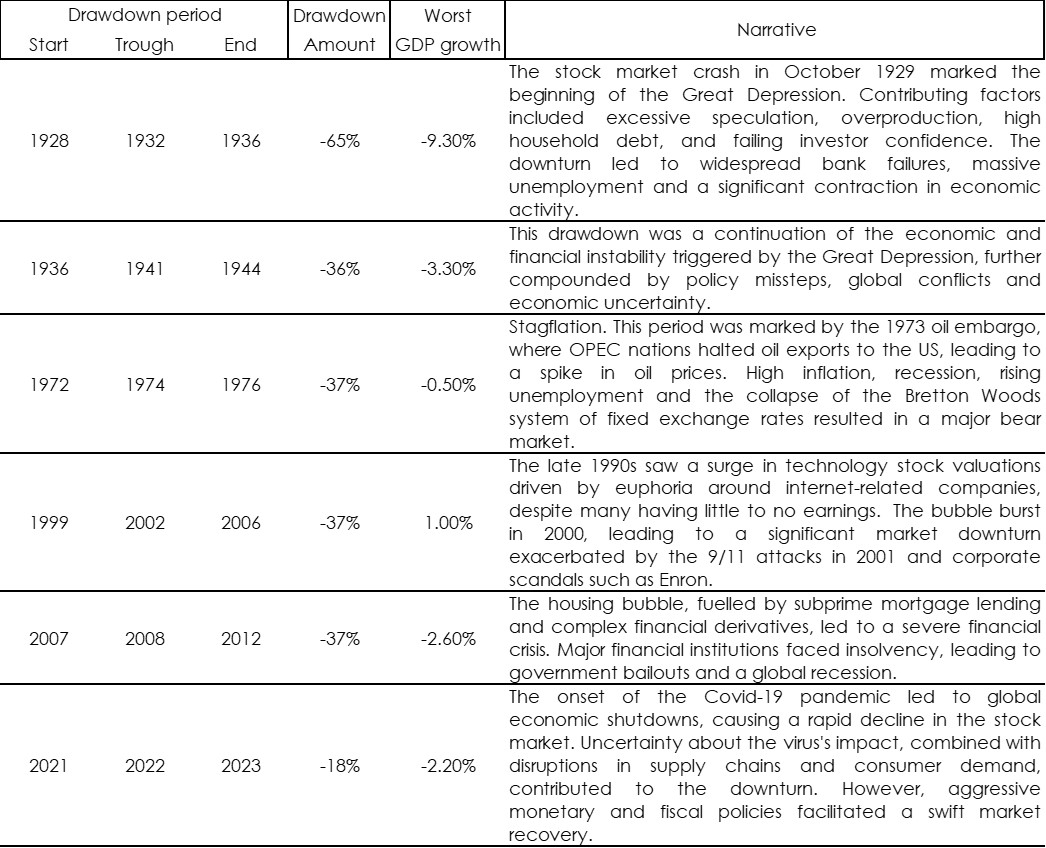
Since 1928, there have been 16 drawdowns in the S&P, 6 larger in magnitude than -15%.[2] Exhibit 3 complements the chart above by summarising the length and depth of S&P drawdowns. Major drawdowns have been caused by a mix of economic crises (e.g., Great Depression, Global Financial Crisis), market speculation and bubbles (e.g., Dot-Com Bubble), external shocks (e.g., Covid-19 pandemic, oil crises). These drawdown episodes have coincided or even contributed to economic contraction or a worsening in economic activity (Appendix 1 gives more detail on the narrative behind the 6 major drawdown episodes).
Drawdown is a crucial risk metric because it quantifies actual losses, which introduce recovery challenges. These challenges include:
Unlike volatility, which measures fluctuations in price which include both upside and downside potential, drawdowns focus specifically on actualized downside risk – how much an investment can decline from its peak before fully recovering. Individual asset classes that exhibit frequent and deep drawdowns may add portfolio risk due to the magnitude required for recovery, but overall portfolio drawdown can be managed using a mix of uncorrelated assets.
Exhibit 3: S&P 500 drawdown and recovery length and magnitude (1928-2024; large drawdowns in bold)
Source: Damodaran dataset, Bank of Singapore.
The Impact of Drawdowns on Investors
Drawdowns can have a significant impact on investors, affecting returns, psychology and investment strategy. Hence, minimizing drawdowns can help to maintain a stable, long-term investment approach. There are several key repercussions on investors:
Returning to Exhibits 2 and 3, we highlight the drawdown for the two worst instances in our sample to illustrate important aspects associated with drawdown costs. During the Great Depression, the drawdown registered in at -65% from the peak (in 1928) to the trough (in 1932). This drawdown episode – from peak to trough to subsequent peak – lasted 8 years until 1936 when a new peak in the value of the S&P portfolio was established. However, this local high was short-lived, and another extended drawdown lasting another 8 years ensued. In this instance, the drawdown was shallower at -35%. During the Great Depression, the value of the S&P portfolio did not recoup its original level in 1928 for a full 16 years!
Let us pause on that for a moment: an investor in the S&P would not have recouped their original investment in 1928 – including dividends being re-invested – until 1944. To regain the first 65% lost, stocks would have needed to return over 180% (as a result of needing to compound at the new lower level) to return to the original pre-drawdown level; and to regain the second round of losses, another 55% in returns was required for a full recovery. This is the classic example of why drawdowns are critical for investors: they disrupt long-term portfolio growth by reducing the capital available for compounding, hence requiring greater returns which (barring a unique sharp recovery such as the post-Covid sell-off and rebound) may take a long time and patience to accumulate to recover losses.
Exhibit 4 charts the relationship between the required return needed to recoup the loss during the S&P drawdown episodes. The relationship is non-linear, with larger drawdowns (such as the 1928 episode of -65%) requiring a quantum more returns (in this case almost 3 times, at 184%) to get back to the pre-drawdown level.
Exhibit 4: S&P 500 Index’s drawdowns and required return to recoup losses (start year of drawdown indicated, 1928-2024)
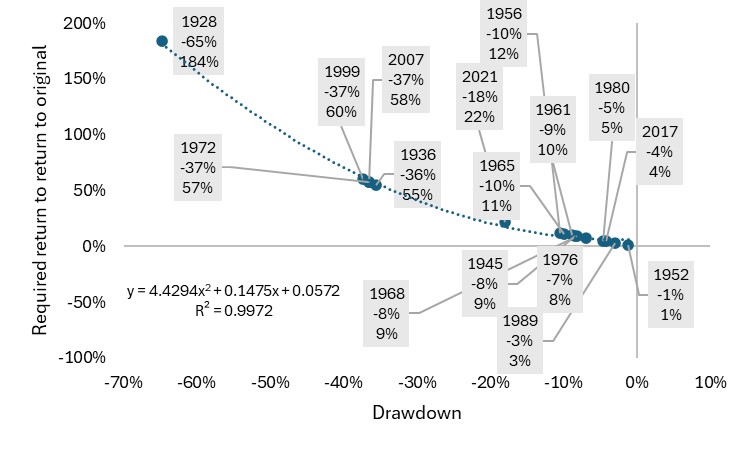
Source: Damodaran dataset, Bank of Singapore.
Strategies to manage and mitigate drawdowns
Since drawdowns provoke material investment costs, investors should consider employing strategic risk management techniques such as diversification, defensive asset allocation, position sizing, and disciplined portfolio rebalancing to minimize losses and preserve long-term growth potential.
Diversification: By spreading investments across different securities (e.g., industries, geographies, asset classes) diversification reduced the impact of any single asset’s drawdown on the overall portfolio. A well-diversified portfolio can help to smooth returns and provide stability during market downturns. The S&P 500 Index, for example, as an index of 500 large cap stocks, is already more diversified than an investment in any one stock.
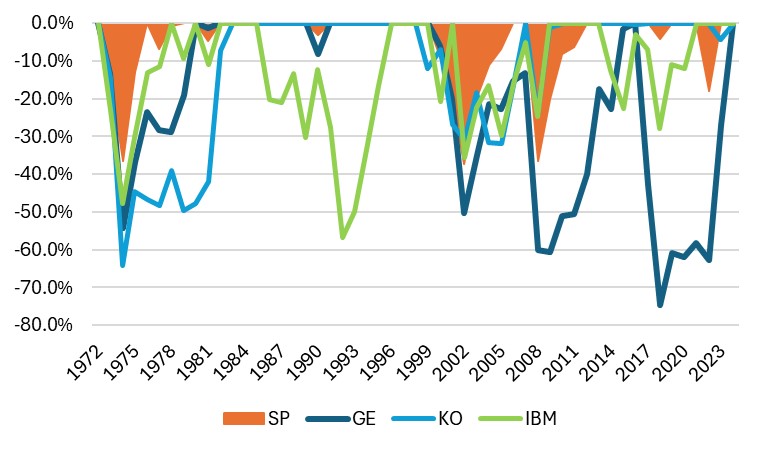
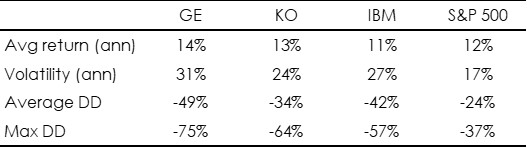
The following chart and table show the drawdowns and key performance metrics for a random sample of US stocks (chosen for the availability of their total return data since 1970 in order to capture multiple drawdown periods): Coco Cola (KO), General Electric (GE), and International Business Machines (IBM), as well as for the S&P Index. The diversified constituents of the S&P 500 Index results in lower volatility as well as shallower average drawdown than any single stock in the sample.
Exhibit 5: Individual stocks and S&P 500 Index drawdowns (1970-2024)
Source: Bloomberg, Damodaran dataset, Bank of Singapore.
Exhibit 6: Individual stocks and S&P 500 Index return and selected risk metrics (1970-2024)
Source: Bloomberg, Damodaran dataset, Bank of Singapore.
Defensive asset allocation: Allocating a portion of the portfolio to lower-risk assets like bonds (Bonds remain a perennial diversifier), or countercyclical assets like gold (Gold Revisited) or acyclical assets like defensive stocks can help cushion losses during broad risk-off episodes. This strategy ensures that when riskier assets experience drawdowns, more stable investments provide balance and limit overall losses.
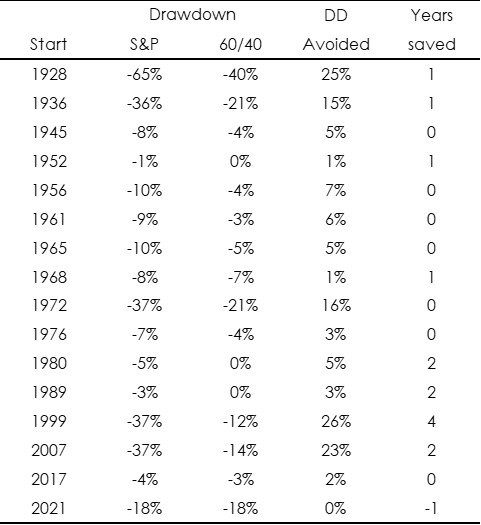
Exhibit 7 summarises the drawdowns from 100% invested in the S&P vs a balanced portfolio of 60% in stocks and 40% in bonds. The penultimate and final columns show the drawdown averted in terms of performance and years saved. For example, a 60-40 portfolio in 1999 would have drawndown 12% vs 27% for a 100% allocation in US equities, hence trimming the cumulative loss by 26ppts, and saving 4 years of time spent in drawdown and recovery.
Drawdown mitigation is not without cost: the average returns for 60-40 portfolios since 1928 is 9%, vs 11.8% for S&P. The exact balance of risk and return will be specific to investor risk preference, as we have described in “Uncertainty in the formation of expectations”. Delving deeper into the different risk characteristics of bonds vs stocks, Appendix 2 takes a return and risk-holistic approach to these two asset classes.
Exhibit 7: S&P 500 Index vs a portfolio of 60% S&P+40% UST drawdowns, comparing the drawdown and time averted (1928-2024)
Source: Damodaran dataset, Bank of Singapore.
Position sizing: Carefully deciding how much capital to allocate to each investment prevents excessive exposure to any single asset. By limiting the size of positions in high-risk investments, investors can reduce the severity of drawdowns and maintain portfolio stability.
Disciplined portfolio rebalancing: Rebalancing ensures that investors maintain the intended asset allocation by selling assets that have increased in value and reallocating to those that have declined. While this means buying assets that are in a drawdown, the key is to do so in a risk-controlled manner – avoiding overexposure while benefitting from potential recoveries. This strategy prevents an unintentional shift towards safer assets at the expense of long-term growth potential.
Long-term perspective: One of the most effective strategies to managing drawdowns is maintaining a long-term investment mindset that stresses fundamentals, earnings, growth and economic trends, and avoiding reactionary decisions based on short-term market movements. Patience and position management can lead to better outcomes: investments grow through compounding returns, meaning that time in the market is more important than timing the market; in our next primer we will go into this in some detail!
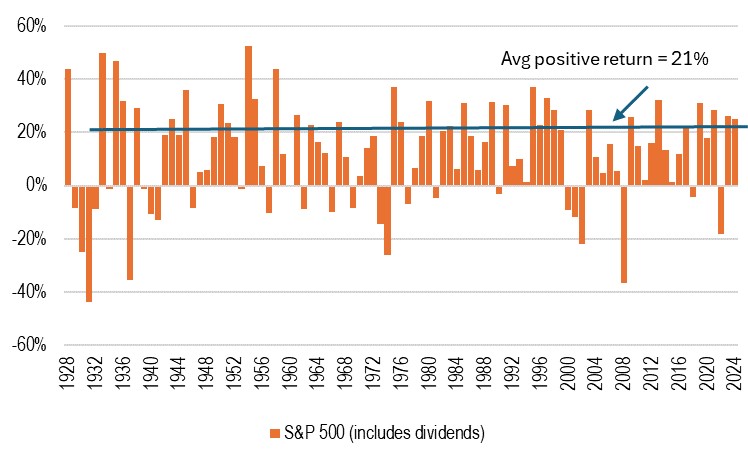
Fear and panic can drive impulsive and sub-optimal decisions, such as selling at the bottom, forgoing the recovery phase, wherein historically in the case of the S&P, most above-average positive returns are concentrated within a period (see Exhibit 8). Having a pre-defined risk management strategy (comprised of all or a combination of the above elements) and staying focused on the fundamentals that underlie investment valuations can help investors stay disciplined.
Exhibit 8: S&P 500 annual returns (1928-2024)
Source: Damodaran dataset, Bank of Singapore.
Implications for investors
Appendix 1: Causes of Major S&P 500 Index Drawdowns in History
Major drawdowns have been caused by a mix of economic crises (e.g., Great Depression, Global Financial Crisis), market speculation and bubbles (e.g., Dot-Com Bubble), external shocks (e.g., Covid-19 pandemic, oil crises). Generally, drawdown episodes coincided with economic contraction or a worsening in economic activity.
Source: Bloomberg, Damodaran, Bank of Singapore.
Appendix 2: Comparing S&P and UST performances using returns, drawdowns and other risk metrics
S&P 500 Index and 10Y US Treasury bond drawdowns (1928-2024)
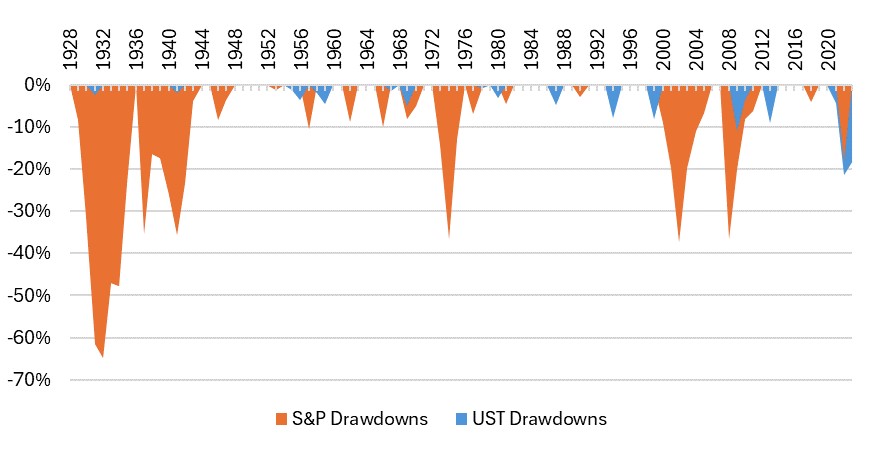
Source: Damodaran, Bank of Singapore.
The above shows the conventional approach of illustrating drawdowns: the orange areas show peak to trough to subsequent peak performance for the S&P, while blue areas show the same for 10Y US Treasuries (UST).
A few points worth noting in comparing the S&P vs UST drawdowns.
The relatively higher risk of equities vs bonds using drawdown measures is consistent with other measures of risk, as summarised in the table in the following page.
The usual approach evaluating investments is to assess historical average return and the volatility of returns.
S&P 500 and 10Y UST returns and risk metrics (calculated using annual data, 1928-2024)
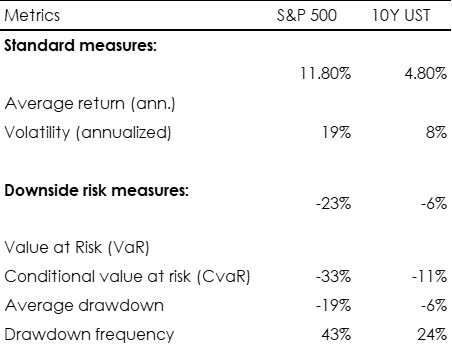
Source: Damodaran, Bank of Singapore.
Volatility gives a sense of the probable range of upside and downside performance. But there are ways to obtain a better approximation of downside risk, or the risk of loss, which is the risk investors worry about. The following risk metrics provide more detailed measures of how the asset classes have behaved in negative outcomes:
How various risk metrics work together in risk analysis
[1] In this study, we chose the data source to obtain as long a timeseries as possible. Our data comes from Professor Aswath Damodaran’s site, housed in NYU Stern School; it serves as a standard in academia:
(http://www.stern.nyu.edu/~adamodar/New_Home_Page/data.html). Only annual data is available, and so our computations may differ from those which use monthly or higher frequency data, and use rolling windows to obtain annualized or other cumulative data.
[2] An arbitrary threshold I have chosen to demarcate significant losses; these tend to also correspond with full drawdown episodes 4 or more years in length.
Important information
This product may only be offered: (i) in Hong Kong, to qualified Private Banking Customers and Professional Investors (as defined under the Securities and Futures Ordinance); and (ii) in Singapore, to Accredited Investors (as defined under the Securities and Futures Act) and (iii) in the Dubai International Financial Center to Professional Clients (as defined under the Dubai Financial Services Authority rules) only. No other person should act on the contents of this document.This product may involve derivatives. Do NOT invest in it unless you fully understand and are willing to assume the risks associated with it. If you have any doubt, you should seek independent professional financial, tax and/or legal advice as you deem necessary.
Please carefully read and make sure that you understand all Risk Disclosures, Selling Restrictions, and Disclaimers. This document must be read together with the relevant Prospectus & Offering Documents &/or Key Fact Statement.
Disclaimer
The Bank, its Affiliates and their respective employees are not in the business of providing, and do not provide, tax, accounting or legal advice to any clients. The material contained herein is prepared for informational purposes and is not intended or written to be used, and cannot be used or relied upon for tax, accounting or legal advice. Any such client is responsible for consulting his/her own independent advisor as to the tax, accounting and legal consequences associated with his/her investments/transactions based on the client’s particular circumstances.
This document and other related documents have not been reviewed by, registered or lodged as a prospectus, information memorandum or profile statement with the Monetary Authority of Singapore nor any regulator in Hong Kong or elsewhere.
This document may not be published, circulated, reproduced or distributed in whole or in part to any other person without the Bank’s prior written consent. This document is not intended for distribution to, publication or use by any person in any jurisdiction outside Singapore, Hong Kong, or such other jurisdiction as the Bank may determine in its absolute discretion, where such distribution, publication or use would be contrary to applicable law or would subject the Bank and its related corporations, connected persons, associated persons and/or affiliates (collectively, “Affiliates”) to any registration, licensing or other requirements within such jurisdiction.